One thing I’ve always liked about theoretical computer science is the number of proofs that are patently ridiculous—whose concluding steps seem to call more for a gong or cymbal than a “QED” box.--Scott Aaronson.
Monday, June 27, 2011
Quote of the day


Sunday, June 26, 2011
Wednesday, May 25, 2011
Where does it end?
The largest opposition party in Poland, Law and Justice, has recently published a pamphlet titled Report on the State of the Republic. For my readers' amusement, I quote a brief passage from this document:
Passenger train transportation is in an abysmal state, as the government has allowed for a situation in which two Polish railroad companies (Intercity and Local Railways) are forced to compete with one another.The horror! Competition can be a good thing but we all know there have to be some limits, or else we're on a slippery slope to Darwinian capitalist anarchy. A Polish company having to compete with another Polish company, that's just perverse!
Monday, May 23, 2011
Nice RIDE
Do you like it when your life gets a lot better completely out of the blue? You probably do. That's the feeling I had when I discovered RStudio, a new (and free) IDE designed especially for R. I've never heard of it being in the works, hence the pleasant surprise. RStudio works really well and is pretty slick. But the absolute best of it for me is that it makes it so easy to use LaTeX due to the fact that it lets you compile Sweave documents directly into PDFs, with just one click. It's godsent, really. It's so great to have your output updated automatically every time you update your code, and without the previous hassle of trying to work Sweave from within R.
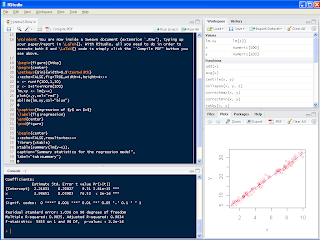

Below are some screenshots of what RStudio can do (the first one shows a simple Sweave document and the output derived from executing the R code within that document, and the second one is the result of compiling the Sweave file into PDF):


Saturday, May 14, 2011
Jay-Z and the eurozone crisis
Four years ago there was a period in which the dollar was sharply losing value against the euro. In the eyes of some analysts at the time, the ultimate sign of dollar's inevitable demise was the fact that, in a contemporary video to his song, Jay-Z was flashing stacks of 500-euro bills.
Someone please let Jay-Z know that Ben Franklin called, and he wants an apology.
Friday, May 6, 2011
In other news, dog steals prescription drugs from man
Big prescription drug scandal in Poland: Pharmacies were illegally hoarding certain very expensive drugs that they were supposed to sell to customers at extremely low prices (set by the legislators), then selling those drugs to third parties which were afterwards re-selling them at market prices abroad. I love quotes from regulators how they were "very surprised" when they've uncovered the whole deal. I mean, what can possibly be more shocking than to see people taking advantage of huge arbitrage opportunities created by stringent price controls?
A striking paragraph
It's from a NYT Magazine article about Air France Flight 447.
She turned her head to watch the kids, then she said: "Children are amazing, you know? A psychologist told us after the accident that children do not have a sense of death until they are 6 or 7. And I radically contest this. When it happened, Jose was 4 years old. And of course, it’s a conversation I will never forget. I told him, 'Listen, there was an accident with Daddy’s plane, and he’s not coming home.' And he started crying as I never saw him cry before. He was saying, 'But there are so many things I wanted to make for him.' "
Saturday, April 30, 2011
More on agriculture productivity
I've written before about the productivity of farming compared to other industries in different countries. In that post I was using a very crude measure of comparative productivity, which was just the fraction of GDP produced by the agriculture sector divided by the sector's relative size. We can do a little better with the use of the World Development Indicators database. The database gives us two valuable indices: value added per agriculture worker and value added per worker in any given country. Knowing the percent of labor force employed in agriculture we can then calculate value added per non-agriculture worker (it's simple arithmetic) and compare the two. In other words, we can calculate directly how much stuff that an agriculture worker is producing on average, as percent of the amount of stuff produced on average by a non-agriculture worker.


So that's what I did for 89 countries of the world, taking each variable of interest as an average between 2000 and 2008. Below are two graphs with the results. (You can click on each graph for a larger image.) The first one shows per worker value added of agriculture plotted against GDP per capita. In Poland, per worker value added is about $2,400. What this means is that, in a year, an average Polish farmer produces stuff that's worth about twenty-four hundred dollars. Yes, you read that right. $2,400. The second graph shows per worker productivity of agriculture in relative terms, i.e. as a percentage of value added per non-farm worker, plotted against the size of employment in agriculture. In Poland, an average farmer produces about 7% of value produced by an average non-farm worker. Yes, you read that right. Seven percent. Seven over one hundred. Zero point oh seven. And the thing to keep in mind is that all this is happening in a situation where agriculture is hugely subsidized. There are direct cash transfers from both the Polish government and the EU. There are price controls in terms of state-guaranteed minimal sale prices of certain agriculture products. And last but not least, farmers in Poland are not required to pay income taxes. Yes, you read that right. Polish farmers are exempt from income taxes.
The second graph is interesting in one more respect, I think. One particular data point jumps out as a huge outlier: Romania. For its relatively low level of income and large size of the agro sector, Romanian agriculture is impossibly productive. I wonder what's going on there. I'll probably be coming back to this stuff at some point. Here are the graphs:


And if you want to see exactly where the measures and the graphs come from, R code is below the fold.
Created by Pretty R at inside-R.org
# pick WDI series, custom names for each series, start year and end year
wdi.vars <- c("SL.GDP.PCAP.EM.KD","EA.PRD.AGRI.KD",
"SL.AGR.EMPL.ZS","NY.GDP.PCAP.CD")
mynames  <- c("gdp.worker","gdp.agrowk","pct.agrowk","gdp.cap")
between  <- c(2000,2008)

# load WDI data
if (require("WDI")==FALSE) {
install.packages("WDI")
library(WDI)
}
wdi.load <- WDI(country="all",indicator=wdi.vars,
start=between[1],end=between[2])

# create a data frame with country-level averages
wdiStat <- function(x,y,z) {
tapply(x,y,z,na.rm=TRUE)
}
A <- apply(wdi.load[,4:ncol(wdi.load)],2,wdiStat,y=wdi.load$country,z=mean)
A <- data.frame(A)
colnames(A) <- mynames

# remove observations with missing values
A <- subset(A,(apply(apply(A,2,is.na),1,sum))==0)
# remove any observations that are not countries
A <- subset(A,(substr(rownames(A),1,4)%in%c("Euro","OECD","High","East",
"Lati","Uppe"))==FALSE)
# remove countries with extremely small populations
A <- subset(A,(rownames(A)%in%c("Barbados","Cyprus","Estonia","Iceland",
"St.Lucia","Latvia","Luxembourg","Malta"))==FALSE)

# create new variables
A$pct.agrowk <- A$pct.agrowk/100
# convert indicator "SL.GDP.PCAP.EM.KD" from 1990 $$ to 2000 $$
A$gdp.worker <- A$gdp.worker*1.32
# gdp.nonagr is value added per non-agriculture worker
gdp.nonagr <- (A$gdp.worker-(A$pct.agrowk*A$gdp.agrowk))/(1-A$pct.agrowk)
agro.share <- A$gdp.agrowk/A$gdp.worker
agro.comp  <- A$gdp.agrowk/gdp.nonagr
burden     <- (gdp.nonagr-A$gdp.worker)/gdp.nonagr
gdp2008    <- as.numeric(wdiStat(wdi.load[,ncol(wdi.load)]
[wdi.load$country%in%rownames(A)],wdi.load$country
[wdi.load$country%in%rownames(A)],max))

# graphs
X <- gdp2008
Y <- A$gdp.agrowk
cutpt <- ((Y > 4000) | (X > 20000))
plot(X,Y,xlim=c(0,70000),
main="Value Added Per Worker in Agriculture and GDP Per Capita",
xlab="2008 GDP Per Capita (Constant 2000 USD)",
ylab="Value Added Per Agriculture Worker (Constant 2000 USD)")
text(x=X[cutpt==TRUE],y=Y[cutpt==TRUE],
labels=rownames(A)[cutpt==TRUE],pos=4,cex=0.8,col="darkgreen")
text(x=X[rownames(A)=="Poland"],y=Y[rownames(A)=="Poland"],
labels=rownames(A)[rownames(A)=="Poland"],pos=4,cex=0.8,col="red")

X <- A$pct.agrowk*100
Y <- agro.comp*100
cutpt2 <- (gdp2008 >= 10000)
plot(X,Y,ylim=c(0,70),xlim=c(0,max(X)),
main="Agriculture: Per Worker Productivity versus Industry Size",
xlab="Percent Employed in Agriculture",
ylab="Agro Worker Output as Percent of Non-Agro Worker Output",cex.main=1.3)
text(x=X[cutpt2==TRUE],y=Y[cutpt2==TRUE],labels=rownames(A)[cutpt2==TRUE],
pos=4,cex=0.6,col="blue")
text(x=X[cutpt2==FALSE],y=Y[cutpt2==FALSE],labels=rownames(A)[cutpt2==FALSE],
pos=4,cex=0.6,col="red")
text(x=60,y=70,"Countries with GDP Per Capita > $10,000",
col="blue",cex=0.8)
text(x=60,y=67,"Countries with GDP Per Capita < $10,000",
col="red",cex=0.8)
Tuesday, April 26, 2011
I knew it all along
Andrew Sullivan's blog pointed me to a magazine article about women marrying the wrong guys, where we can read the following:
According to recent research conducted by Jennifer Gauvain, a therapist inActually, I think this raises at least two questions much more obvious than that. First, has Jennifer Gauvain, a therapist in Denver, ever heard of hindsight bias? Second, when she was conducting her study, did she already know in her gut that her research design is completely useless?
Denver, 30 percent of now-divorced women say they knew in their gut they were
making a mistake as they walked down the isle--and kept walking anyway. Only a
handful backed out. The obvious question: If you know you're marrying the wrong
guy, why do it?
Friday, April 22, 2011
Those who win are good at winning
Let's begin with a famous quote from an equally famous paper:
This statement has a huge potential for being a tautology, however. In a straightforward interpretation, it implies that if some institutions do not preserve initial conditions that breed them, they don't survive. So saying that institutions preserve conditions that gave rise to them may be like saying that all living organisms are great at reproducing. It's false, but superficial observation seems to confirm it because the only living organisms we see are those that are great at reproducing. Because those that are not that great at it aren't around for us to see. Because they hadn't been reproducing.
The early differences in the extent of inequality across New World economies may have been preserved by the types of economic institutions that evolved and by the effects of those institutions on how broadly access to economic opportunities was shared. This path of institutional development may in turn have affected growth.In other words, there is positive feedback from economic conditions to political institutions. Or, paraphrased in a way I've heard in many econ and poli sci classes, institutions preserve conditions that gave rise to them.
This statement has a huge potential for being a tautology, however. In a straightforward interpretation, it implies that if some institutions do not preserve initial conditions that breed them, they don't survive. So saying that institutions preserve conditions that gave rise to them may be like saying that all living organisms are great at reproducing. It's false, but superficial observation seems to confirm it because the only living organisms we see are those that are great at reproducing. Because those that are not that great at it aren't around for us to see. Because they hadn't been reproducing.
Subscribe to:
Posts (Atom)