
Showing posts with label R. Show all posts
Showing posts with label R. Show all posts
Wednesday, August 8, 2012


Saturday, April 28, 2012
Like French
Evaluating the Design of the R Language is the first paper about R aimed at the academic programming language community. Memorable one-liner:
As a language, R is like French; it has an elegant core, but every rule comes with a set of ad-hoc exceptions that directly contradict it.
Wednesday, February 29, 2012
Happy Birthday R
Speaking of R, it is celebrating a birthday today. Quoting from an R-help mailing list post by Andy Bunn:
R is refined, tasteful, and beautiful. When I grow up, I want to marry R.Well, given that R is twelve, Andy might be waiting for the wrong party to grow up. At any rate, to the creators of R: Holy shit, thank you.
Tuesday, February 28, 2012
Editors large and small
Now that the makers of RStudio added seemingly all of the features it was missing, both minor (bracket matching) and major (project manager and version control), their product is officially perfect. It's truly amazing. It basically has all of the functionality of Eclipse with StatET but is much easier to install and runs R code much faster in interactive mode.
Speaking of speed though: sometimes it's still not quite fast enough. This means there's sometimes a need for me to have a backup solution: something that would be a decent code editor (i.e. have at least syntax highlighting, an object browser, and block commenting/uncommenting of code lines), while allowing me to push code to R terminal in order to run it. I did try Emacs and Vim but quickly gave up. It may very well be true that they're much better than everything else, but I'm not a programmer, I'm just a data analyst, so forgive me for thinking that a code editor should be something that makes my life easier right now as opposed to five months down the line. I've also tried Tinn-R but that was a disappointment: it doesn't have an object browser and the interface is horribly cluttered.
I did finally find a good piecemeal solution though: Notepad++ with NppToR, with object browsing via this simple function written by Petr Pikal. Here's a screenshot:

It works well. Still, I don't use it unless I absolutely have to. RStudio is just so much more convenient.
Speaking of speed though: sometimes it's still not quite fast enough. This means there's sometimes a need for me to have a backup solution: something that would be a decent code editor (i.e. have at least syntax highlighting, an object browser, and block commenting/uncommenting of code lines), while allowing me to push code to R terminal in order to run it. I did try Emacs and Vim but quickly gave up. It may very well be true that they're much better than everything else, but I'm not a programmer, I'm just a data analyst, so forgive me for thinking that a code editor should be something that makes my life easier right now as opposed to five months down the line. I've also tried Tinn-R but that was a disappointment: it doesn't have an object browser and the interface is horribly cluttered.
I did finally find a good piecemeal solution though: Notepad++ with NppToR, with object browsing via this simple function written by Petr Pikal. Here's a screenshot:

It works well. Still, I don't use it unless I absolutely have to. RStudio is just so much more convenient.
Tuesday, December 6, 2011
Suboptimal equilibrium
Let's not kid ourselves: the software most widely used for statistics is Excel.--Brian D. Ripley (one of the developers of R)
Wednesday, August 3, 2011
An even better one
Here's the new and improved weasel program. It removes a major inefficiency of the version I posted yesterday, in that in any given generation only one string was reproducing. Since in any generation (except of course the last two of them), the content of the fittest string need not be unique, it could speed up evolution a lot if we allow all maximum fitness strings to reproduce. The program below does just that. Now with the number of offspring = 100 and a mutation rate of 5%, it never takes more than 30 generations to achieve convergence. The output of R code below displays all maximum fitness strings from each generation.
# A Version of Dawkins' Weasel in R
# (c) 2011 Przemyslaw Nowaczyk

Weasel <- function(phrase,num.copies,mutation.rate) {
  Score  <- function(x,y) {sum(x==y)}
  Output <- function(x,y,z) {cat(x,y,z,"\n")}
  alphabet <- toupper(c(letters," "))
  split.phrase <- unlist(strsplit(phrase,""))
  new.phrase   <- as.matrix(sample(alphabet,size=nchar(phrase),replace=TRUE))
  max.fitness  <- Score(new.phrase,split.phrase)
  generation   <- 0
  while (max.fitness < length(split.phrase)) {
    offspring   <- new.phrase[,rep(1:ncol(new.phrase),num.copies)]
    mutant.flag <- mat.or.vec(nrow(offspring),ncol(offspring))
    mutant.flag <- sample(c(0,1),prob=c((1-mutation.rate),mutation.rate),
                          replace=TRUE,size=(nrow(offspring)*ncol(offspring)))
    offspring[mutant.flag==1] <- sample(alphabet,size=sum(mutant.flag),
                                        replace=TRUE)
    fitness <- apply(offspring,2,Score,y=split.phrase)
    fit.id  <- which(fitness==max(fitness))
    new.phrase  <- as.matrix(offspring[,fit.id[1:length(fit.id)]])
    max.fitness <- max(fitness)
    generation  <- generation + 1
    apply(new.phrase,2,Output,y=generation,
     z=round((max.fitness/nchar(phrase))*100,digits=2))
  }
}

# sample run with timing
system.time(Weasel(phrase="METHINKS IT IS LIKE A WEASEL",num.copies=10,
                   mutation.rate=0.01))
Tuesday, August 2, 2011
Weasel
Dawkins' weasel is a toy model of evolution in which the goal is to write an algorithm that evolves the phrase "METHINKS IT IS LIKE A WEASEL" out of a random string of 28 characters via random mutation and non-random selection. The one constraint on the algorithm is that you're not allowed to "lock in" characters; i.e. if one of your strings happens to contain the right character in the right position, you can't exclude that character from the possibility of mutating.
Created by Pretty R at inside-R.org
I wrote a weasel program in R, in which the "evolution" proceeds as follows: you draw a random string of 28 characters; the string "breeds" n "offspring," but each character in each of the offspring strings has a probability m of mutating into any character of the alphabet; each mutated string gets a fitness score which is simply the number of same characters in the same position as in the target string; (one of the) strings with the highest fitness survives and breeds in the next generation while the rest are erased.
Below is a sample run of an R-weasel with the number of offspring = 100 an mutation rate = 0.05 (the number to the right of each string is its fitness score):
1 L Z F Z N Y O F N O Z E B I X N P X H B O P U M L A 1
2 L Z F Z N Y O F N O Z E B I N P X H K O P U I L A 2
3 L Z F Z N Y O F N O D E B I N P X H K O P U I L L 3
4 L Z F Z N Y O F N O D E B I L P X H K O P U I L L 4
5 L Z T Z N Y O F S O D E B I L P X H K O P U I L L 5
6 L Z T H N Y O F S O D E B I L P X H K O P U I L L 6
7 L Z T H N Y O F S O D E B I L P X H K O P U I L L 6
8 L Z T H N Y O F S O D E I I L P X H K O P U I L L 7
9 L Z T H N Y O F S O D E I S L P X H K O P U I L L 8
10 L E T H N Y O F S O D E I S L P X H K O P U I H L 9
11 L E T H N N O F S O Q E I S L P X H K O P U I H L 10
12 L E T H N N O S S O Q E I S L P X H K O P U I H L 11
13 L E T H N N O S S O Q E I S L P K I K O P U I H L 12
14 L E T H N N O S S O Q E I S L P K I A P U I H L 13
15 L E T H N N O S S A T E I S L P K I A P U I H L 14
16 L E T H N N O S S A T E I S L P K I A P U M E L 15
17 L E T H N N O S S A T X I S L P K I W P U M E L 16
18 L E T H N N O S S A T X I S L P K I W P U M E L 16
19 L E T H N N O S U A T X I S L P K I W P U M E L 16
20 L E T H N N O S U A T X I S L P K A W P U M E L 17
21 L E T H N N O S U B T X I S L P K A W P U M E L 17
22 L E T H I N O S U B T X I S L P K A W P U M E L 18
23 L E T H I N O S U N T X I S L P K A W P U M E L 18
24 L E T H I N O S U N T G I S L P K A W P U M E L 18
25 M E T H I N O S U N T G I S L P K A W P U M E L 19
26 M E T H I N K S U N T G I S L P K A W P U M E L 20
27 M E T H I N K S U I T G I S L P K A W P U M E L 21
28 M E T H I N K S I T G I S L P K A W P U M E L 22
29 M E T H I N K S I T U I S L I K A W P U G E L 23
30 M E T H I N K S I T U I S L I K E A W P U G E L 24
31 M E T H I N K S I T U I S L I K E A W P U G E L 24
32 M E T H I N K S I T U I S L I K E A W P U G E L 24
33 M E T H I N K S I T U I S L I K E A W P U G E L 24
34 M E T H I N K S I T U I S L I K E A W P U G E L 24
35 M E T H I N K S I T U I S L I K E A W P U G E L 24
36 M E T H I N K S I T U I S L I K E A W P U G E L 24
37 M E T H I N K S I T I S L I K E A W P U G E L 25
38 M E T H I N K S I T I S L I K E A W I U G E L 25
39 M E T H I N K S I T I S L I K E A W M A G E L 26
40 M E T H I N K S I T I S L I K E A W E A G E L 27
41 M E T H I N K S I T I S L I K E A W E A G E L 27
42 M E T H I N K S I T I S L I K E A W E A G E L 27
43 M E T H I N K S I T I S L I K E A W E A G E L 27
44 M E T H I N K S I T I S L I K E A W E A G E L 27
45 M E T H I N K S I T I S L I K E A W E A G E L 27
46 M E T H I N K S I T I S L I K E A W E A G E L 27
47 M E T H I N K S I T I S L I K E A W E A G E L 27
48 M E T H I N K S I T I S L I K E A W E A G E L 27
49 M E T H I N K S I T I S L I K E A W E A G E L 27
50 M E T H I N K S I T I S L I K E A W E A G E L 27
51 M E T H I N K S I T I S L I K E A W E A G E L 27
52 M E T H I N K S I T I S L I K E A W E A G E L 27
53 M E T H I N K S I T I S L I K E A W E A G E L 27
54 M E T H I N K S I T I S L I K E A W E A G E L 27
55 M E T H I N K S I T I S L I K E A W E A S E L 28
user system elapsed
0.09 0.00 0.10
This is not a typical run; it's on the shorter side (for these parameters the median length is something like 70). Note how fast it converges though; R can be quite fast f you do things in vectors and matrices rather than loops.
The next step is to allow the strings to mate and swap their genes.
R code for the weasel is below the fold.
# A Version of Dawkins' Weasel in R
# (c) Przemyslaw Nowaczyk 2011

score <- function(x,y) {sum(x==y)}

weasel <- function(phrase,no.kids,mutation.rate) {
  alphabet <- c("A","B","C","D","E","F","G","H","I","J","K","L","M","N",
                "O","P","Q","R","S","T","U","V","W","X","Y","Z"," ")
  split.phrase <- unlist(strsplit(phrase,""))
  new.phrase   <- sample(alphabet,size=nchar(phrase),replace=TRUE)
  distance     <- score(new.phrase,split.phrase)
  generation   <- 0

  while (distance < length(split.phrase)) {
    m.newph     <- as.matrix(new.phrase)
    offspring   <- m.newph[,rep(1,no.kids)]
    mutant.flag <- mat.or.vec(nrow(offspring),ncol(offspring))
    mutant.flag <- sample(c(0,1),prob=c((1-mutation.rate),mutation.rate),
                          replace=TRUE,size=(nrow(offspring)*ncol(offspring)))
    offspring[mutant.flag==1] <-
      sample(alphabet,size=length(mutant.flag[mutant.flag==1]),replace=TRUE)
    scores <- apply(offspring,2,score,y=split.phrase)
    new.phrase <- offspring[,which(scores==max(scores))[1]]
    distance   <- score(new.phrase,split.phrase)
    generation <- generation + 1
    cat(generation,new.phrase,distance,"\n")
  }
}

# sample run with timing
system.time(weasel(phrase="METHINKS IT IS LIKE A WEASEL",no.kids=100,
                   mutation.rate=0.05))
Saturday, July 30, 2011
If statistical packages were books
Which books would they be? Here's what I think:
1. SPSS: Dan Brown, The Da Vinci Code (hardcover edition)
Best summed up by a quote from Homer Simpson: "You take forever to say nothing!" There are people out there who actually think this is a great book. The rest of the world thinks those people are crazy and, while no one goes as far as to advocate isolating them, no one lets them babysit their children either. To make up for its fatal flaws in narrative, historical plausibility, character development, and a laughable plot, the book is also very expensive.
2. Microsoft Excel: J.R.R. Tolkien, The Hobbit
This is a book everyone has read and enjoyed, though no one is bragging about it. Despite being so low-brow, however, this is actually a very decent book. As long, of course, as you take it for what it is; some read it as though it were The Lord of the Rings, which can lead to bitter disappointment.
3. Stata: Terry Pratchett, Discworld
It's a niche book that all of its readers for some reason think is mainstream. It's an incredibly fast and entertaining read, but don't let that fool you: it's full of profound insights and reading it can be an unexpectedly powerful experience.
4. SAS: The Bible
Everyone has a copy, but no one remembers how they got it. It's everyone's answer to "What's the greatest book of all time?", but no one is sure why. It's an incredibly hard book to read, but common wisdom claims that if you understand it, you can find in it things that no other book can offer. Those who do understand it and have found these things, however, seem to be unable to effectively communicate their experience; and if you ask them to, they'll usually tell you to go back and read the book yourself. It's written in style that requires four paragraphs to say "Hello." Nothing is what it seems and no one does anything expected. Every once in a while, however, it will offer a passage that will answer one of your deep questions or solve one of your deep problems. And then, as soon as you try to tell someone about what happened, you'll find that they just can't understand.
5. R: Leo Tolstoy, War and Peace
It's long. It's one of the longest books ever. Takes forever to read. It's so damn long that many times you'll be convinced there's no way you can finish it. In addition, Tolstoy fans (as opposed to Pratchett fans) can be quite an annoying and pretentious crowd. Everyone would like their friends to think they've actually read War an Peace. But hey, don't blame Tolstoy for it: the book is great. Sure, it could be simpler and shorter. But it has a lot to offer. It can make you think differently about what you thought you already knew. It can make you notice that things you previously took for solutions to problems are actually nothing more than one-time acts of desperation. And every once in a while, it can even entertain you.
Sunday, July 3, 2011
Education in Poland is not underfunded, take 2
This is a footnote to a previous post arguing that education in Poland is not underfunded, with the graphical part of the argument made more persuasive by the use of a great R package called rworldmap:


How much bang for the buck this spending offers, however, is a different question:

Wednesday, June 29, 2011
Education in Poland is not underfunded
I know you might find it hard to believe, especially if you live in Poland, but what the title says is true. Relative to income, Poland spends on education about as much as the next guy. Here are some graphs which compare different measures of relative spending in Poland to that in a sample of about 100 countries (all statistics are 2000-2010 averages taken from the World Development Indicators database).


Below the fold is a table with the entire sample.


Below the fold is a table with the entire sample.
| Spending For Education As Pct of GNI | Public Spending For Education As Pct of GDP | Per Pupil Spending/GDP Per Capita | |
|---|---|---|---|
| Albania | 2.84 | 2.87 | 14.02 |
| Algeria | 4.47 | 4.34 | 18.17 |
| Argentina | 4.48 | 4.31 | 20.33 |
| Armenia | 2.22 | 2.56 | 13.55 |
| Australia | 4.68 | 4.71 | 20.71 |
| Austria | 5.46 | 5.59 | 38.78 |
| Azerbaijan | 2.96 | 2.73 | 12.05 |
| Bangladesh | 1.75 | 2.40 | 10.78 |
| Belarus | 5.24 | 5.52 | 34.79 |
| Belgium | 4.67 | 6.01 | 29.88 |
| Benin | 3.15 | 3.61 | 15.78 |
| Bolivia | 5.41 | 6.06 | 19.39 |
| Brazil | 4.24 | 4.36 | 18.09 |
| Bulgaria | 3.60 | 3.81 | 27.27 |
| BurkinaFaso | 3.33 | 4.52 | 33.44 |
| Burundi | 4.72 | 5.18 | 28.86 |
| Cambodia | 1.66 | 1.76 | 7.22 |
| Cameroon | 2.57 | 3.02 | 11.92 |
| Canada | 5.00 | 5.13 | 30.47 |
| Chad | 1.66 | 2.40 | 9.39 |
| Chile | 3.65 | 3.73 | 16.73 |
| Colombia | 3.60 | 4.15 | 16.96 |
| Congo,Rep. | 3.38 | 2.54 | 9.40 |
| CostaRica | 4.54 | 4.99 | 22.70 |
| Coted'Ivoire | 4.25 | 4.27 | 27.90 |
| Croatia | 3.82 | 4.19 | 31.07 |
| CzechRepublic | 4.05 | 4.29 | 25.92 |
| Denmark | 7.77 | 8.25 | 49.37 |
| DominicanRepublic | 1.92 | 2.07 | 8.30 |
| Ecuador | 1.38 | 1.15 | 5.84 |
| Egypt,ArabRep. | 4.41 | 4.31 | 20.28 |
| ElSalvador | 2.79 | 2.89 | 11.23 |
| Ethiopia | 2.90 | 4.47 | 18.42 |
| Finland | 5.68 | 6.17 | 35.04 |
| France | 5.11 | 5.66 | 32.88 |
| Georgia | 3.39 | 2.59 | 19.30 |
| Germany | 4.31 | 4.45 | 30.44 |
| Greece | 3.06 | 3.64 | 24.95 |
| Guinea | 2.23 | 2.27 | 13.18 |
| HongKongSAR,China | 3.26 | 4.03 | 23.94 |
| Hungary | 5.18 | 5.30 | 34.53 |
| India | 3.75 | 3.54 | 18.46 |
| Indonesia | 1.80 | 2.99 | 9.60 |
| Iran,IslamicRep. | 4.38 | 4.82 | 18.10 |
| Ireland | 4.94 | 4.54 | 22.96 |
| Israel | 6.22 | 6.43 | 29.75 |
| Italy | 4.32 | 4.59 | 34.28 |
| Japan | 3.19 | 3.59 | 26.75 |
| Kazakhstan | 4.41 | 2.71 | 19.56 |
| Kenya | 6.14 | 6.32 | 27.40 |
| Korea,Rep. | 3.60 | 4.21 | 22.68 |
| KyrgyzRepublic | 4.59 | 4.86 | 21.54 |
| LaoPDR | 1.11 | 2.39 | 5.26 |
| Lebanon | 2.30 | 2.42 | 10.79 |
| Liberia | 3.08 | 2.77 | 16.90 |
| Lithuania | 5.03 | 5.21 | 26.18 |
| Malawi | 3.61 | 4.66 | 14.08 |
| Malaysia | 4.68 | 6.15 | 20.54 |
| Mali | 3.27 | 3.91 | 21.33 |
| Mexico | 4.91 | 5.01 | 20.09 |
| Moldova | 5.90 | 6.78 | 41.13 |
| Morocco | 5.34 | 5.63 | 28.56 |
| Mozambique | 3.23 | 4.89 | 17.10 |
| Nepal | 2.62 | 3.60 | 12.75 |
| Netherlands | 4.74 | 5.29 | 28.92 |
| NewZealand | 6.84 | 6.50 | 31.28 |
| Nicaragua | 3.03 | 3.38 | 12.04 |
| Niger | 2.83 | 3.40 | 33.56 |
| Norway | 6.44 | 7.06 | 36.39 |
| Pakistan | 2.07 | 2.38 | 14.00 |
| Panama | 4.31 | 4.30 | 18.88 |
| Paraguay | 4.12 | 4.65 | 16.28 |
| Peru | 2.68 | 2.75 | 10.31 |
| Philippines | 2.65 | 2.94 | 12.79 |
| Poland | 4.94 | 5.27 | 27.81 |
| Portugal | 5.32 | 5.44 | 35.84 |
| Romania | 3.23 | 3.46 | 22.16 |
| RussianFederation | 3.54 | 3.53 | 25.44 |
| Rwanda | 3.51 | 4.39 | 16.14 |
| SaudiArabia | 7.19 | 6.55 | 28.99 |
| Senegal | 3.91 | 4.23 | 29.12 |
| SierraLeone | 4.06 | 4.16 | 20.46 |
| Singapore | 2.32 | 2.91 | 19.48 |
| SlovakRepublic | 3.86 | 4.00 | 21.37 |
| SouthAfrica | 5.23 | 5.28 | 20.57 |
| Spain | 3.95 | 4.27 | 29.97 |
| Sweden | 7.06 | 7.04 | 40.36 |
| Switzerland | 4.80 | 5.58 | 34.42 |
| SyrianArabRepublic | 2.60 | 5.09 | 11.72 |
| Tajikistan | 2.78 | 2.95 | 12.18 |
| Thailand | 4.70 | 4.37 | 29.37 |
| Togo | 3.70 | 3.91 | 16.21 |
| Tunisia | 6.47 | 7.05 | 25.98 |
| Uganda | 2.91 | 3.59 | 10.85 |
| Ukraine | 4.99 | 5.34 | 37.24 |
| UnitedKingdom | 5.18 | 5.16 | 31.30 |
| UnitedStates | 4.79 | 5.61 | 29.52 |
| Uruguay | 2.30 | 2.53 | 10.88 |
| Vietnam | 2.81 | 5.34 | 12.80 |
| Yemen,Rep. | 4.16 | 8.21 | 31.42 |
| Zambia | 2.11 | 1.95 | 7.64 |
Monday, May 23, 2011
Nice RIDE
Do you like it when your life gets a lot better completely out of the blue? You probably do. That's the feeling I had when I discovered RStudio, a new (and free) IDE designed especially for R. I've never heard of it being in the works, hence the pleasant surprise. RStudio works really well and is pretty slick. But the absolute best of it for me is that it makes it so easy to use LaTeX due to the fact that it lets you compile Sweave documents directly into PDFs, with just one click. It's godsent, really. It's so great to have your output updated automatically every time you update your code, and without the previous hassle of trying to work Sweave from within R.
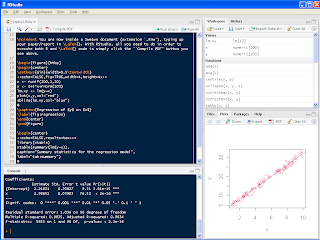

Below are some screenshots of what RStudio can do (the first one shows a simple Sweave document and the output derived from executing the R code within that document, and the second one is the result of compiling the Sweave file into PDF):


Saturday, April 30, 2011
More on agriculture productivity
I've written before about the productivity of farming compared to other industries in different countries. In that post I was using a very crude measure of comparative productivity, which was just the fraction of GDP produced by the agriculture sector divided by the sector's relative size. We can do a little better with the use of the World Development Indicators database. The database gives us two valuable indices: value added per agriculture worker and value added per worker in any given country. Knowing the percent of labor force employed in agriculture we can then calculate value added per non-agriculture worker (it's simple arithmetic) and compare the two. In other words, we can calculate directly how much stuff that an agriculture worker is producing on average, as percent of the amount of stuff produced on average by a non-agriculture worker.


So that's what I did for 89 countries of the world, taking each variable of interest as an average between 2000 and 2008. Below are two graphs with the results. (You can click on each graph for a larger image.) The first one shows per worker value added of agriculture plotted against GDP per capita. In Poland, per worker value added is about $2,400. What this means is that, in a year, an average Polish farmer produces stuff that's worth about twenty-four hundred dollars. Yes, you read that right. $2,400. The second graph shows per worker productivity of agriculture in relative terms, i.e. as a percentage of value added per non-farm worker, plotted against the size of employment in agriculture. In Poland, an average farmer produces about 7% of value produced by an average non-farm worker. Yes, you read that right. Seven percent. Seven over one hundred. Zero point oh seven. And the thing to keep in mind is that all this is happening in a situation where agriculture is hugely subsidized. There are direct cash transfers from both the Polish government and the EU. There are price controls in terms of state-guaranteed minimal sale prices of certain agriculture products. And last but not least, farmers in Poland are not required to pay income taxes. Yes, you read that right. Polish farmers are exempt from income taxes.
The second graph is interesting in one more respect, I think. One particular data point jumps out as a huge outlier: Romania. For its relatively low level of income and large size of the agro sector, Romanian agriculture is impossibly productive. I wonder what's going on there. I'll probably be coming back to this stuff at some point. Here are the graphs:


And if you want to see exactly where the measures and the graphs come from, R code is below the fold.
Created by Pretty R at inside-R.org
# pick WDI series, custom names for each series, start year and end year
wdi.vars <- c("SL.GDP.PCAP.EM.KD","EA.PRD.AGRI.KD",
"SL.AGR.EMPL.ZS","NY.GDP.PCAP.CD")
mynames  <- c("gdp.worker","gdp.agrowk","pct.agrowk","gdp.cap")
between  <- c(2000,2008)

# load WDI data
if (require("WDI")==FALSE) {
install.packages("WDI")
library(WDI)
}
wdi.load <- WDI(country="all",indicator=wdi.vars,
start=between[1],end=between[2])

# create a data frame with country-level averages
wdiStat <- function(x,y,z) {
tapply(x,y,z,na.rm=TRUE)
}
A <- apply(wdi.load[,4:ncol(wdi.load)],2,wdiStat,y=wdi.load$country,z=mean)
A <- data.frame(A)
colnames(A) <- mynames

# remove observations with missing values
A <- subset(A,(apply(apply(A,2,is.na),1,sum))==0)
# remove any observations that are not countries
A <- subset(A,(substr(rownames(A),1,4)%in%c("Euro","OECD","High","East",
"Lati","Uppe"))==FALSE)
# remove countries with extremely small populations
A <- subset(A,(rownames(A)%in%c("Barbados","Cyprus","Estonia","Iceland",
"St.Lucia","Latvia","Luxembourg","Malta"))==FALSE)

# create new variables
A$pct.agrowk <- A$pct.agrowk/100
# convert indicator "SL.GDP.PCAP.EM.KD" from 1990 $$ to 2000 $$
A$gdp.worker <- A$gdp.worker*1.32
# gdp.nonagr is value added per non-agriculture worker
gdp.nonagr <- (A$gdp.worker-(A$pct.agrowk*A$gdp.agrowk))/(1-A$pct.agrowk)
agro.share <- A$gdp.agrowk/A$gdp.worker
agro.comp  <- A$gdp.agrowk/gdp.nonagr
burden     <- (gdp.nonagr-A$gdp.worker)/gdp.nonagr
gdp2008    <- as.numeric(wdiStat(wdi.load[,ncol(wdi.load)]
[wdi.load$country%in%rownames(A)],wdi.load$country
[wdi.load$country%in%rownames(A)],max))

# graphs
X <- gdp2008
Y <- A$gdp.agrowk
cutpt <- ((Y > 4000) | (X > 20000))
plot(X,Y,xlim=c(0,70000),
main="Value Added Per Worker in Agriculture and GDP Per Capita",
xlab="2008 GDP Per Capita (Constant 2000 USD)",
ylab="Value Added Per Agriculture Worker (Constant 2000 USD)")
text(x=X[cutpt==TRUE],y=Y[cutpt==TRUE],
labels=rownames(A)[cutpt==TRUE],pos=4,cex=0.8,col="darkgreen")
text(x=X[rownames(A)=="Poland"],y=Y[rownames(A)=="Poland"],
labels=rownames(A)[rownames(A)=="Poland"],pos=4,cex=0.8,col="red")

X <- A$pct.agrowk*100
Y <- agro.comp*100
cutpt2 <- (gdp2008 >= 10000)
plot(X,Y,ylim=c(0,70),xlim=c(0,max(X)),
main="Agriculture: Per Worker Productivity versus Industry Size",
xlab="Percent Employed in Agriculture",
ylab="Agro Worker Output as Percent of Non-Agro Worker Output",cex.main=1.3)
text(x=X[cutpt2==TRUE],y=Y[cutpt2==TRUE],labels=rownames(A)[cutpt2==TRUE],
pos=4,cex=0.6,col="blue")
text(x=X[cutpt2==FALSE],y=Y[cutpt2==FALSE],labels=rownames(A)[cutpt2==FALSE],
pos=4,cex=0.6,col="red")
text(x=60,y=70,"Countries with GDP Per Capita > $10,000",
col="blue",cex=0.8)
text(x=60,y=67,"Countries with GDP Per Capita < $10,000",
col="red",cex=0.8)
Saturday, March 13, 2010
There are absolutely no limits to what people can convince themselves of
For example, you can make yourself believe that Polish economy was in a much better shape before Poland joined the European Union than it is now. I'm not joking; if you don't believe me (and speak Polish), see here. The author of the linked post, Magda Figurska, makes altogether too many ridiculous statements to try to debunk all of them, so I'll just pick a few of the most egregious ones.
 Try as I might, I really cannot see much trade destruction going on here. Now for the first part of the statement: that during the waiting period before joining the EU we have lost "80% of productive assets." I am not sure what Figurska means by "productive assets," and she does not provide any sources of this rather staggering claim, so all I can do is speculate. At any rate, there are only two possibilities: she either means "production" or something else. If she means "production," then her statement is ridiculously wrong: the output of Polish economy has never contracted since 1990. If she means something else, then her statement is meaningless: if it is possible for a country to "lose 80% of its productive assets" but nonetheless consistently increase its production, then I submit that "productive assets" is not a terribly useful concept.
Let's start off gently. Ms. Figurska counts the fact that EU regulations forbid member states from taxing goods and services imported from other member states on a level higher than they tax their own goods and services, as a cost of joining. The thoughts that 1) taxing imports means higher prices for Polish consumers and 2) this regulation favors Polish exports in foreign markets, apparently do not cross her mind. Figurska then writes:
The sum total of our contributions to the EU budget (...) exceeds the amount of money we receive from it.The truth, as it were, is exactly the other way around: Poland is a net beneficiary of the EU budget. Then, Figurska shifts gears and enters the Conservapedia mode: her claims become so stupid they are actually entertaining. Take this, for example:
During the so-called adjustment period, we have lost 80% of productive assets, destroyed our trade (...)Let's take the second part of this statement first. Here's a graph illustrating the dynamics of Polish trade between 2000 and 2008 (the source of data is the CIA World Factbook):
 Try as I might, I really cannot see much trade destruction going on here. Now for the first part of the statement: that during the waiting period before joining the EU we have lost "80% of productive assets." I am not sure what Figurska means by "productive assets," and she does not provide any sources of this rather staggering claim, so all I can do is speculate. At any rate, there are only two possibilities: she either means "production" or something else. If she means "production," then her statement is ridiculously wrong: the output of Polish economy has never contracted since 1990. If she means something else, then her statement is meaningless: if it is possible for a country to "lose 80% of its productive assets" but nonetheless consistently increase its production, then I submit that "productive assets" is not a terribly useful concept.
Now let me quote this sentence again, this time in its entirety:
During the so-called adjustment period, we have lost 80% of productive assets, destroyed our trade, our best businesses, steel mills, coal mines, sugar refineries, centers of scientific, technical, medical and agricultural thought.There's really not a whole lot one can say to that, except: what world do you live in? Where on Earth did you see all those amazing things you write about that once existed but now are no more?
I'm not saying that all of the economic growth we've experienced is due to joining the EU. I think a lot of it is, but I don't know how much, exactly, and it is possible to make informed arguments to the effect that if we didn't join, we'd have grown even faster. But if you're telling me that our economy is in a catastrophically worse shape now than it has been in before 2004, you're simply ignorant.
Subscribe to:
Posts (Atom)